
Tunnelling Case Study
Background
In 2019, the progenitor of Process Flow Intelligence (PFI) and now sister entity, Industrial Tomography Systems (ITS) collaborated with a world leading civil engineering firm to assess electrical resistance tomography (ERT)’s applicability and effectiveness in the tunnelling industry by way of a side-by-side comparison with an in-line nuclear densitometer. The engineering firm in question cannot be divulged for reasons of commercial sensitivity.
This 2019 project not only informs the present case study, but also laid the groundwork for the development of the PFI i-Flow Smart Meter, an ERT device designed specifically for the tunnelling industry. Launched in 2025, the i-Flow Smart Meter not only measures slurry concentration/density, but can also measure slurry/solid velocity and slurry bed-height all from one integrated device.
Technical Considerations & Solutions
Electrical resistance tomography (ERT) is predicated on measuring and mapping the relative electrical conductive properties of the fluidised components found in the slurry pipeline. The accuracy of ERT’s conductivity map, along with associated qualitative and quantitative data, is dependent on acquiring a reliable reference reading at the start of the tunnelling operation.
This problem was solved by taking a reference reading from the Slurry Line prior to the commencement of tunnelling operations when the Slurry Line only contained water and bentonite. The reference reading forms a benchmark to contrast with the electrical conductivity of the contents of the Slurry Line during tunnelling operations which comes to contain dissolved solids transported from the face of the tunnelling operation – alongside water and bentonite already present and expressed in the reference reading.
Installation Considerations: ERT v Gamma
One of ERT’s major advantages is that it only requires one sensor installed in the Slurry Line. The pre-operational automatic reference reading is obtained from the Slurry Line and provides the benchmark against which slurry density/concentration is both quantified and visualised as a tomogram.
This lies in direct contrast with nuclear densitometry which requires two systems with sensors located in both the Feed Line and the Slurry Line. Slurry density/concentration is calculated according to the differential between the Feed Line and Slurry Line. Alongside doubling the cost, as a result of installing two sensors, it also increases the regulatory burden resulting from the literal doubling of the safety concerns that even one gamma densitometer has in isolation.
Results
The comparison trial between ERT and gamma densitometry was conducted on the 20-21 of September 2019 between the hours of 15:23:01 and 06:37:45 where the tunnelling system advanced 4 times, with ERT’s auto-referencing function being triggered 8 times – see the table below. 5 auto-references were taken immediately prior to the tunnelling system advancing. The other 3 references were taken during periods of non-operation.

The graph below shows a side-by-side comparison between ERT and the gamma slurry density measurements, obtained by the offset between the Feed Line and the Slurry Line, for the full duration of the trial – alongside points when ERT’s auto-referencing function was triggered.
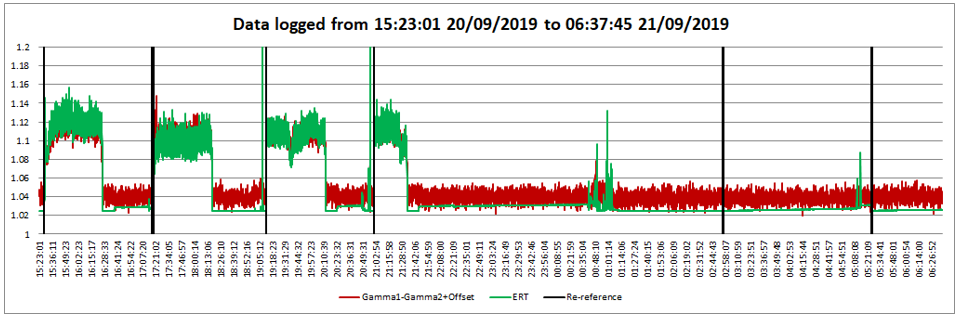
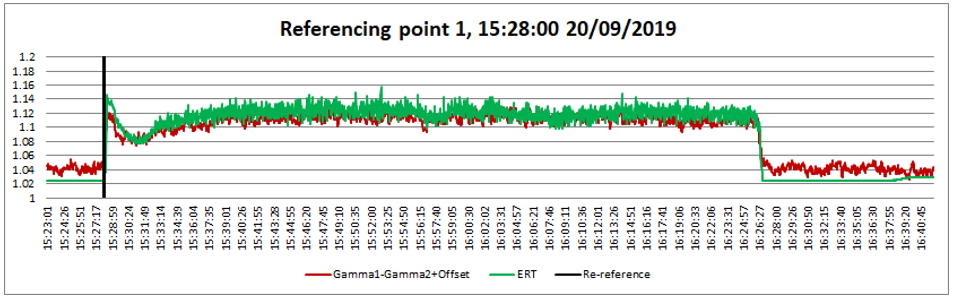
ERT showed excellent agreement with gamma technology when taken as a whole. It is interesting to take a closer look at the first referencing point as being emblematic of the whole trial and provides a closer insight into the excellence of ERT’s accuracy when compared alongside gamma densitometry. The ERT spikes around the 01:01:14 mark are a result of air slugs in the Slurry Line.
Summary and Conclusions
- The tunnelling project referred to in this case study was carried out in 2019 using an older ERT system where external referencing was used successfully. It should be emphasised that, since its launch in 2025, the i-Flow Smart Meter also has an auto-reference function. The tunnelling operator now has the option of either using an external reference or the i-Flow’s auto-reference function.
- The mean relative difference between ERT and gamma was less than 1% as illustrated in the table below which represents ERT’s outstanding accuracy. This makes a compelling case for ERT, especially when fiscal considerations like ERT’s superior CAPEX and OPEX attributes are considered compared with the higher costs overall costs associated with gamma densitometry.

Contact us
For more information please get in touch with a member of our team.
TELEPHONE
Address
Dickinson House,20 Dickinson Street,Manchester,M1 4LF
